How to create custom engagement reports on Outplay
Generate engagement reports with data metrics of your choice
On Outplay, you can generate reports for all types of engagement activities initiated by users and teams. Need to keep track of your team’s email metrics? Or do you want individual user engagement reports? We’ve got you covered.
Gain invaluable insights into your engagements and drive better sales outcomes!
This article discusses the following:
View the Leaderboard
View engagement reports
Create custom engagement reports
Generate statistical graphic charts for engagement reports
Export an engagement report
View the Leaderboard
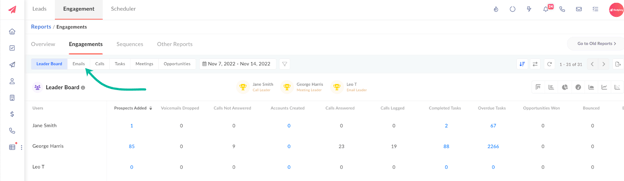
The Leaderboard displays a list of your top performers and different metrics that measure the engagement performance of users.
Log into Outplay.

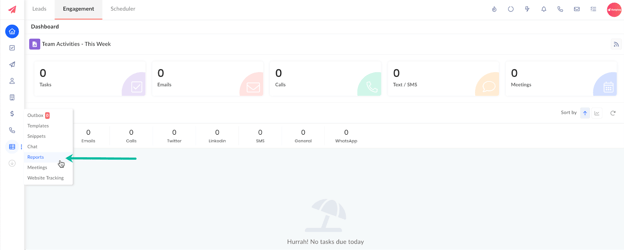
Under the Engagement section, click Reports from the sidebar menu.

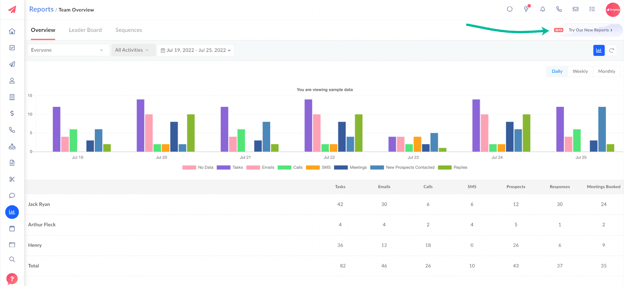
Click Try Our New Reports.

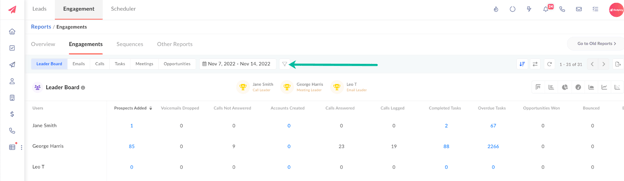
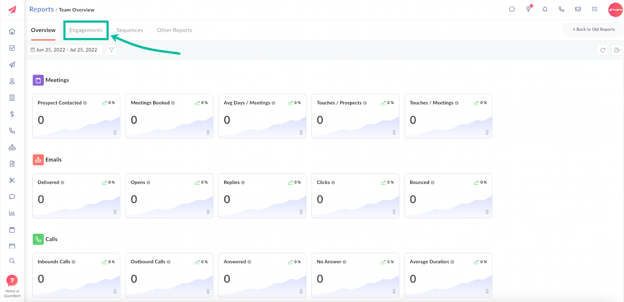
Click the Engagements tab.

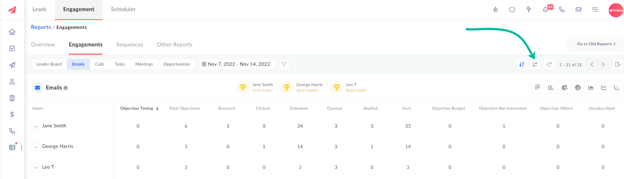
Here, you can view your top performers and data metrics that measure their engagement performance.

On the top panel, you can find the Call Leader, Meeting Leader and Email Leader.

Click the Column Arrangement button to add the other data metrics to the Leaderboard.

Click the Filter button to select and apply various criteria to view a more detailed report.
View engagement reports
On Outplay, you can choose the engagement type - be it email, calls, tasks, meetings, or opportunity, and view an in-depth report for the same.
NOTE: The process is the same for all engagement types.
Here’s how you can go about it:
Log into Outplay.
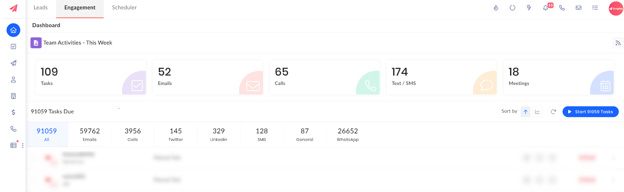
Under the Engagement section, click Reports from the sidebar menu.
Click Try Our New Reports.
Click the Engagements tab.
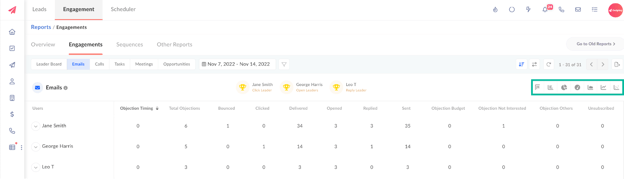
Select the type of engagement for which you want to analyze reports.
NOTE: The process is the same for all engagement types.
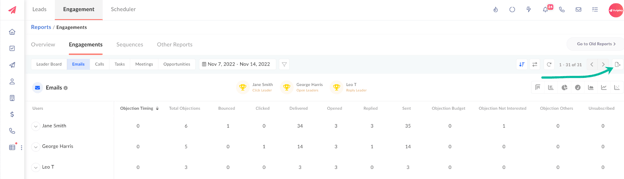
Here, you can view a list of your top performers and their email metrics. The Click Leader, Open Leader and Reply Leader is displayed on the top panel.
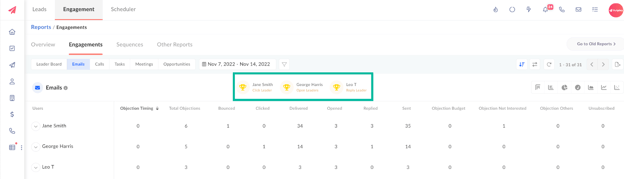
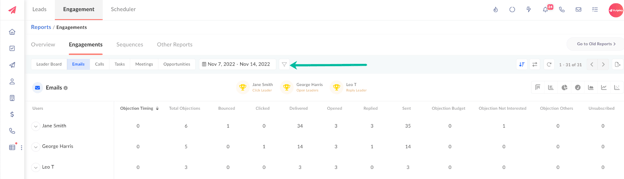
Click the Filters button to select and apply several criteria to view a more detailed report.
TIP: Once filters are applied in Reports, they will persist even when you navigate away and return to Reports.
Create custom engagement reports
Here’s how you can create custom engagement reports with data metrics of your choice:
NOTE: The process is the same for all engagement types.
Log into Outplay.
Under the Engagement section, click Reports from the sidebar menu.
Click Try Our New Reports.
Click the Engagements tab.
Select the type of report you want to create. You can select Emails, Calls, Tasks, Meetings or Opportunities.
NOTE: The process is the same for all engagement types.
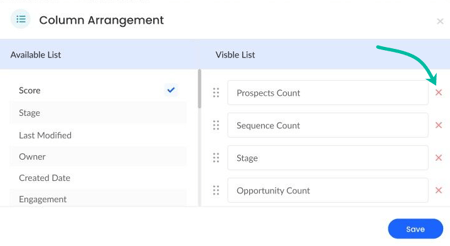
Click the Column Arrangement button to create a view with the data metrics of your choice.
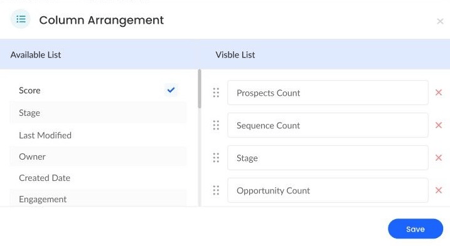
The Column Arrangement window pops up. Here, you can find two sections:
Available List: Displays a list of engagement metrics that can be added to and viewed in the engagement reports.
Visible List: Displays a list of engagement metrics that are already visible in the engagement reports.
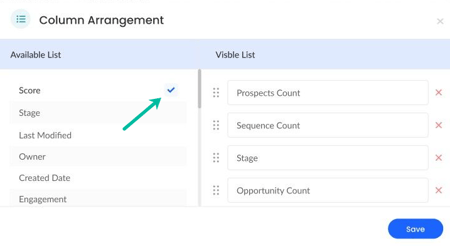
To add a specific engagement metric, the metric can be selected from the Available List and added to the Visible List.
You can arrange the columns in the engagement report by organizing the metrics in the Visible List in the desired order using the move icon.
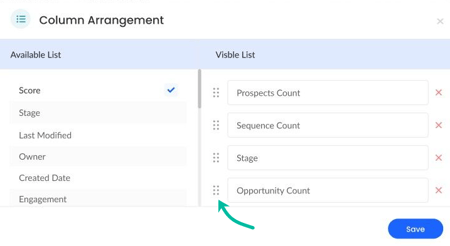
You can remove an engagement metric by clicking the delete icon next to it in the Visible List.
Generate statistical graphic charts for engagement reports
On Outplay, you can generate visual engagement reports with ease. Here’s how you can go about it:
Log into Outplay.
Under the Engagement section, click Reports from the sidebar menu.
Click Try Our New Reports.
Click the Engagements tab.
Select the type of report you want to create. You can select Emails, Calls, Tasks, Meetings or Opportunities.
NOTE: The process is the same for all engagement types.
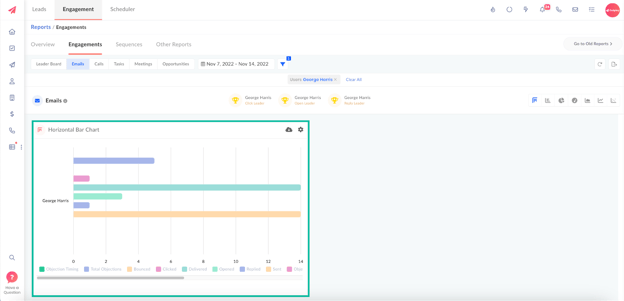
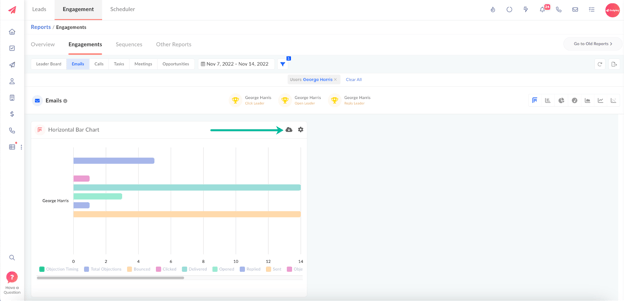
Click any of the Graphic Chart buttons. You can select from the following statistical graphic charts:
Horizontal Bar Chart
Vertical Bar Chart
Pie Chart
Gauge Chart
Area Chart
Line Chart
Bubble Chart
The statistical graphic chart with the selected data metrics is displayed.
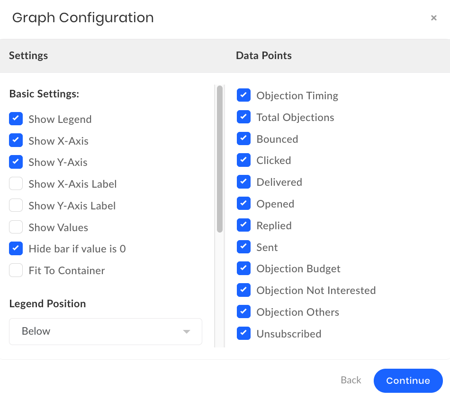
Click the gear icon for a statistical graph chart to configure the same.
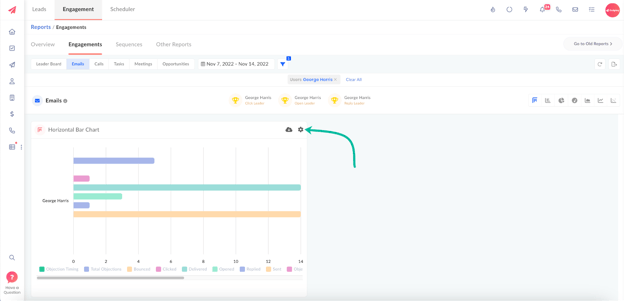
The Graph Configuration chart pops up. Here, you can select the data points you want to see on the graph. You can even c*onfigure basic settings** and the legend position of the graph.
Click the Download button to export the graph.
The statistical graph chart is generated and downloaded to your system.
Export an engagement report
On Outplay, you can download any engagement report with the data metrics of your choice:
On the engagement report page of your choice, click the Export button.
The report along with all the visible data points is exported and downloaded to your system as a worksheet.
NOTE: If filters are applied, only the data metrics that meet the criteria are exported and downloaded.
Updated on: 27/06/2024
Thank you!