
In this article, we will discuss the new Outplay Reporting Dashboard.
We have introduced a new reporting page as per the request of Outplayers.
To navigate to the new reporting, click on the "Try Our New Reporting" icon in Reports.-gif.gif)
Currently, The new reporting is divided into 2 sections, Overview, and Sequences.
Overview Reporting Tab.
The overview tab shows the overall statics of the platform for the date range chosen.
Here, users can drag and drop the cards as per their requirements and change their views, increasing/decreasing the size of the cards.
The overview contains info related to Meetings, Calls, Emails, Tasks, Opportunities.
Meetings: This section will have 5 kinds of cards available. 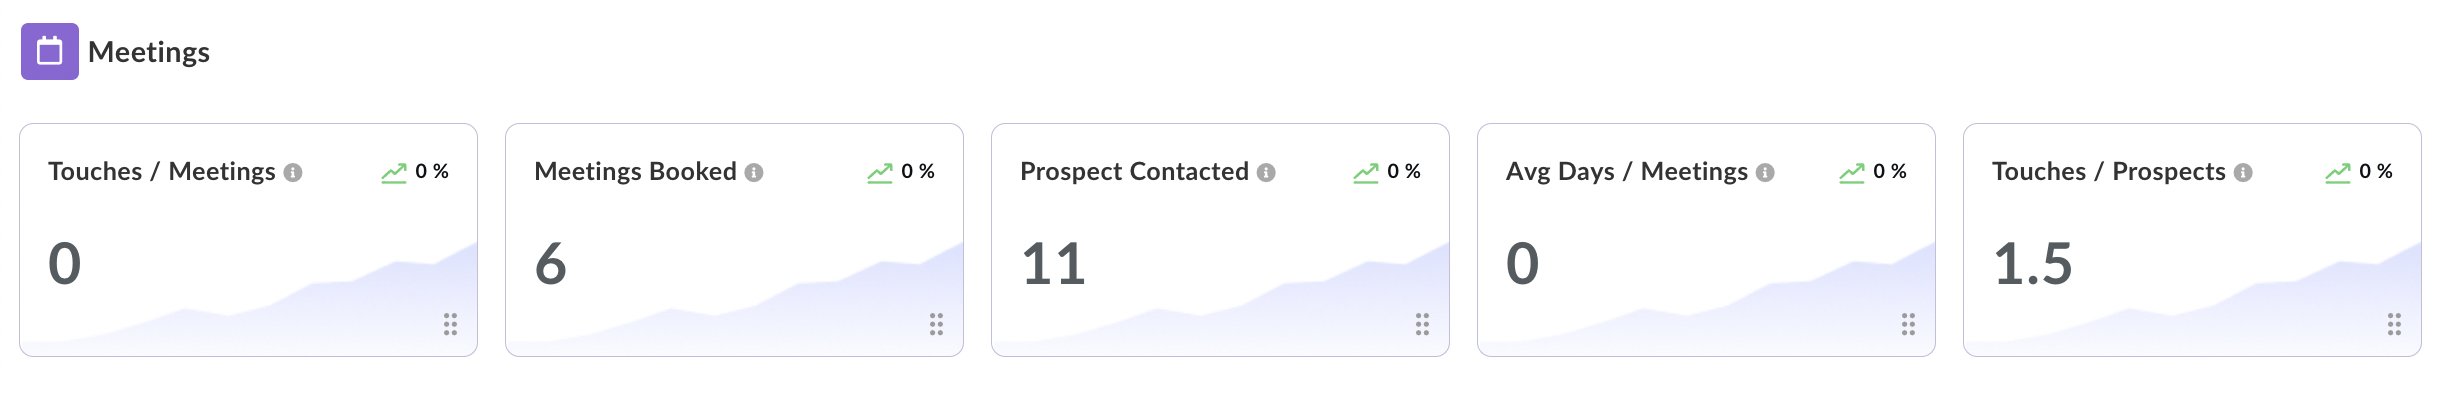
- Prospects Contacted: This card shows how many prospects have been contacted. Clicking on the prospects card will take the user to the prospects tab.
- Meetings booked: This card shows how many prospects have booked the meetings. Clicking on the meetings booked card will take the user to the meetings booked tab.
- Avg Days / Meeting: This card shows what is the avg days took to book the first meeting. This card will not be clickable.
- Avg Touches / Prospects: This card shows avg touches it took per prospect. This card will not be clickable
- Touches / Meetings: This card shows the total no. of touches it took per total no. of meetings booked. This card will not be clickable
The card will also the date range against which the data is visible.
Emails: This section will have 4 kinds of cards available. 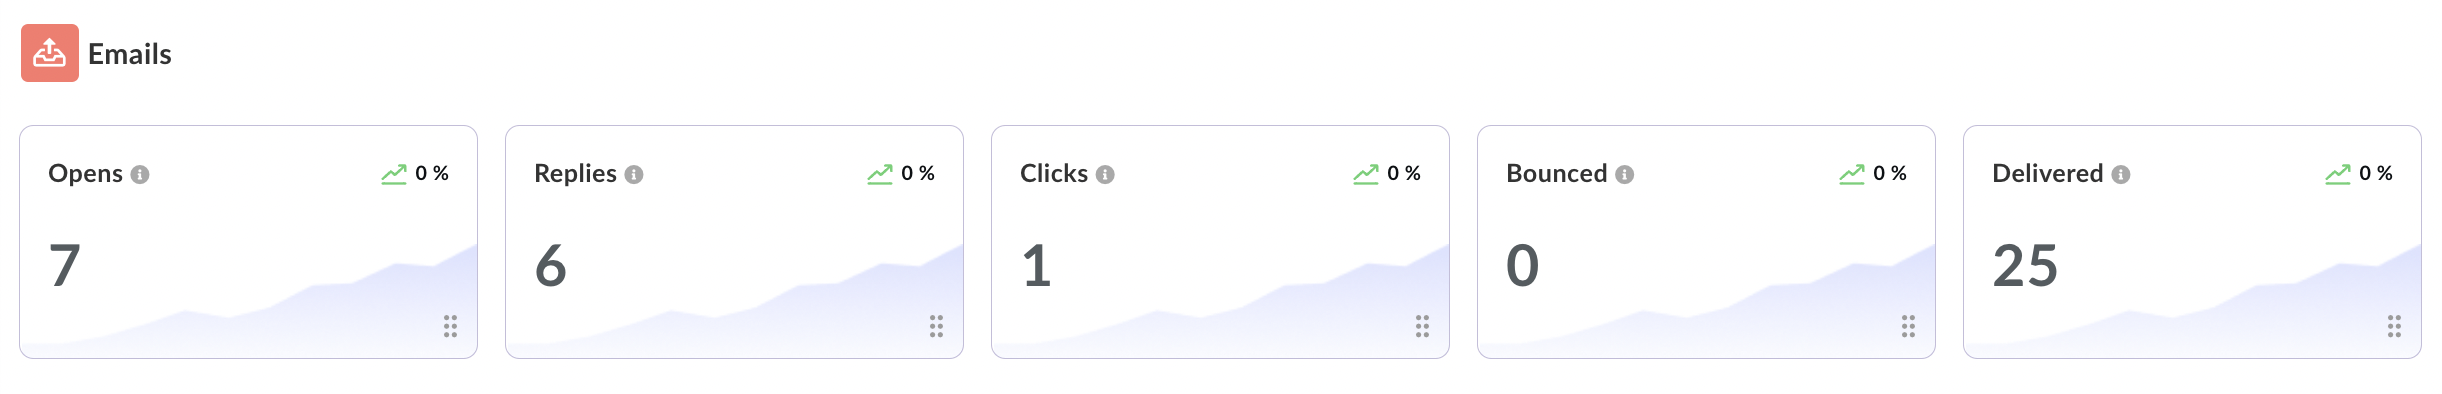
- Delivered: This card shows how many emails have been delivered. The current logic which is set up has to be used to calculate the numbers.
- Opens: This card shows how many emails have been opened. The current logic which is set up has to be used to calculate the numbers. Replies: This card shows how many replies have been received. The current logic which is set up has to be used to calculate the numbers.
- Clicks: This card shows how many clicks have been done. The current logic which is set up has to be used to calculate the numbers.
Calls: This section will have 5 kinds of cards available.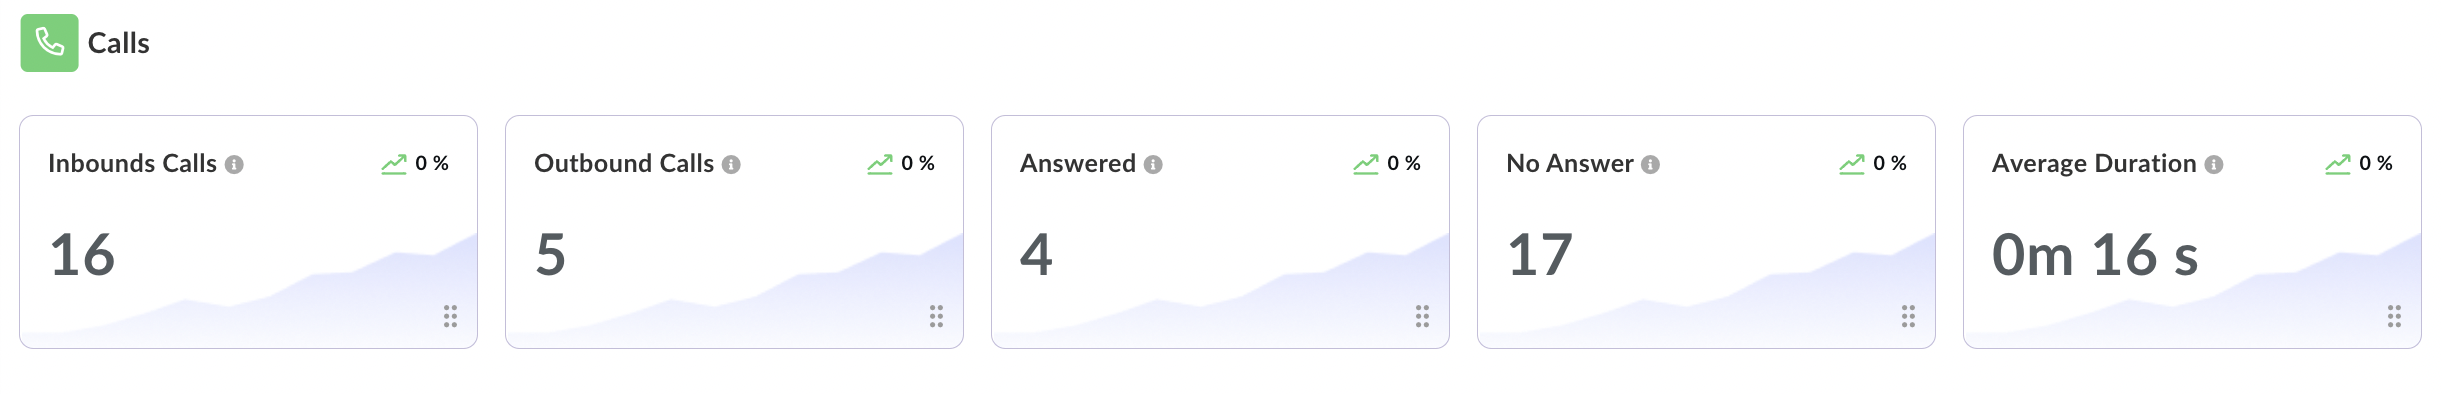
- Inbound calls: This card shows the total no. of inbound calls.
- Outbound calls: This card shows the total no. of outbound calls.
- Answered: This card shows the total no. of calls answered.
- No Answer: This card shows the total no. of calls that are not answered.
- Average Duration: This card shows the average duration of the calls in the selected date range
Tasks: This section will have 2 kinds of cards available 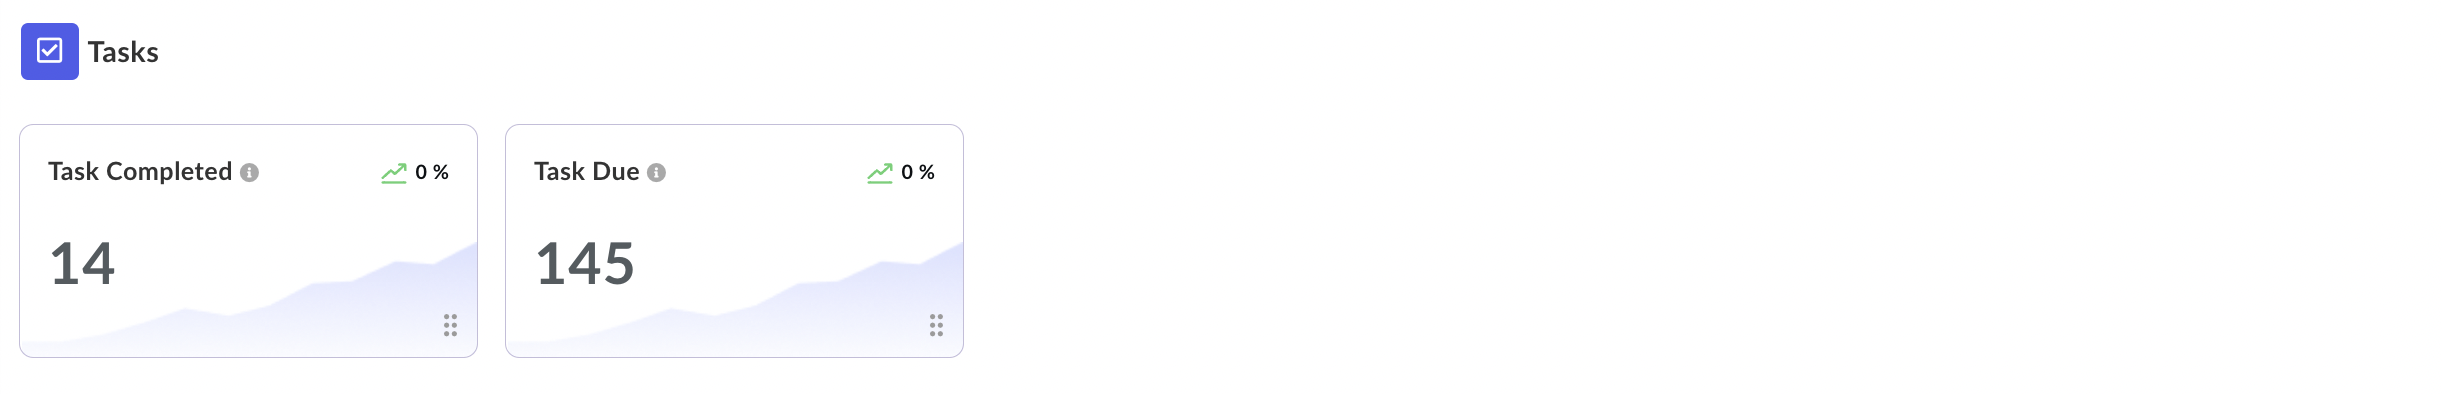
- Task Completed: This card shows the total no. of tasks completed in the selected date range.
- Task Due: This card shows the total no. of tasks due in the selected date range.
Opportunities: This section will have 5 kinds of cards available.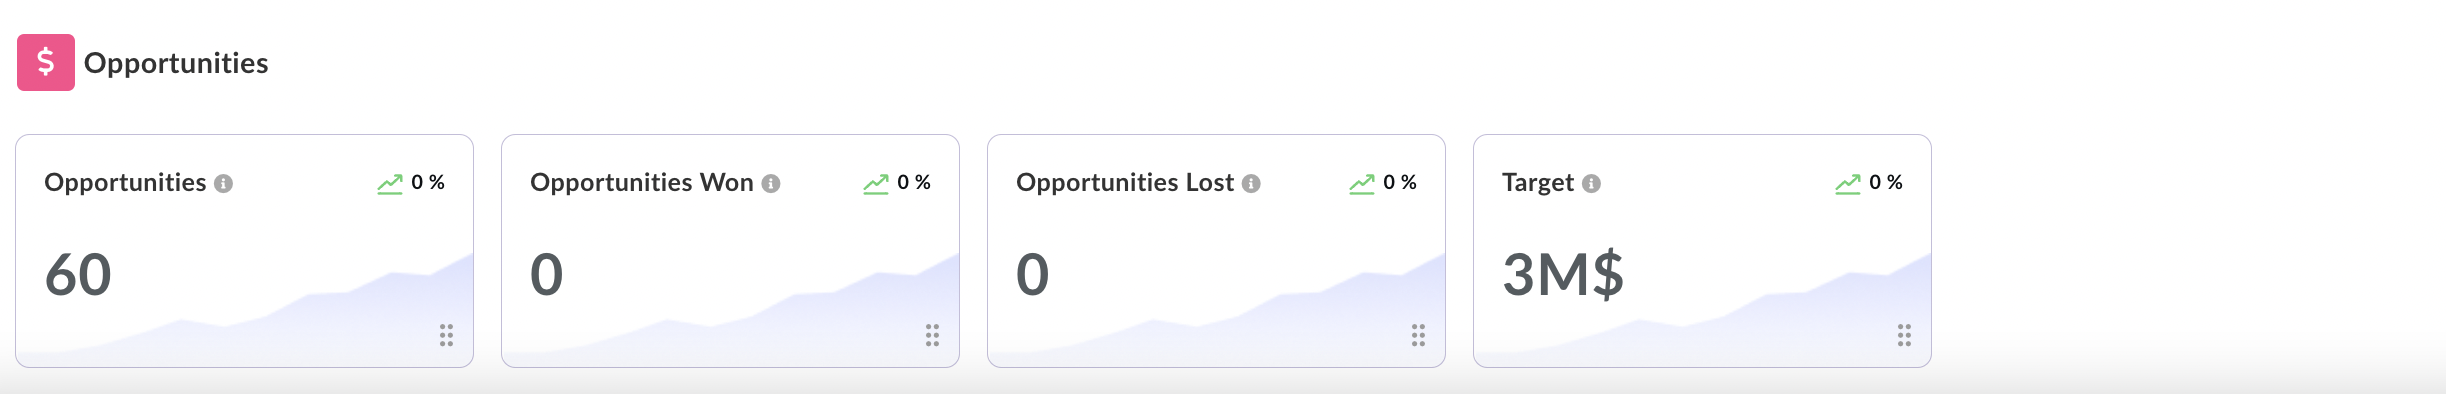
- Opportunities: The no. of opportunities whose close date is falling in the selected date range.
- Opportunities Won: The no. of opportunities won in the selected date range.
- Opportunities Lost: The no. of opportunities lost in the selected date range.
- Target: The target set in the selected date range.
Filters on Overview: There are two types of filters available 
- Date Range: The user can select any date range and apply the same. Basis the applied date range, the numbers in every card will populate.
- Compare: Compare will be on two parameters i.e. Date range and Team/users.
- Date Range: The user can compare the data basis the date range e.g. Compare with the last 30 days/last 2months or custom date range.
- Team/users: User can compare the data basis the team comparison e.g. Team A vs Team B or User A vs User B.
On comparison;
Every card will show a graph inside in it which will show comparison w.r.t selected date range. A small bar graph will appear inside the graph and if the graph is in red then it means there is a fall that happened w.r.t selected date range and if the graph is in green then it means there is an increase happened in the respective tab.
Export: The user can export the whole information available in the overview tab data in CSV format export.-gif.gif)
The exported file will contain the filter used as the Headers and the comparative values shown in the cells below.
Sequence Reports
In the sequence section of the new Reporting, the user will have an option to filter the exact sequence based on either the user, team, or the sequence name. Clicking on the sequence name will expand the view and the user can see the steps of the sequence with the relevant data for it as well.
Please check out the screenshot below - 
- Prospects Enrolled: Number of prospects enrolled in the sequence.
- Meetings Booked: Number of meetings booked within the time period chosen
- Open Rate: Number of emails opened in the sequence.
- Click Rate: Number of links clicked in the sequence.
- Reply Rate: Replies received within the sequence.
- Bounce Rate: Number of emails bounced.
- Opt-Out: Number of users/prospects opted out from the sequence.
- Deliveries: Number of deliveries within the sequence.
Users will be able to sort the data visible in ascending or descending order depending on the variable chosen.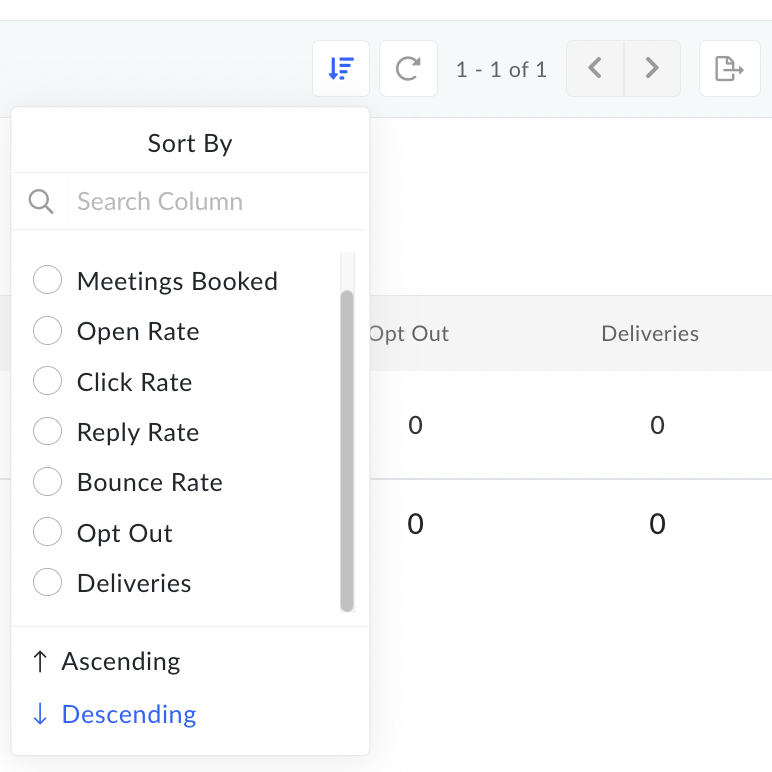
Export: The user can export the whole information available in the Sequence tab data in CSV format export.