How to create custom dashboard on Outplay
Track Your Team's Success with Ease
Custom Dashboards on Outplay allows you to monitor your team's performance with ease by creating a tailored view of key metrics and data points. It enables you to choose what information you want to track and display, allowing you to focus on the aspects of your team's performance that are most important to you.
By using custom dashboards, you can quickly and easily view the key metrics and data points that you need to stay informed and make informed decisions about your team's performance. Whether you want to track your team's email response time, call efficiency, or activity report, a custom dashboard provides you with a centralized location to view all of the information you need in real-time.
Here’s how you can create a custom dashboard on Outplay:
Log into Outplay. In the Engagement section, click the More Options button on the sidebar menu and select the Reports option.

Click Go to New Reports.

Click the Dashboards tab.

Here, you can choose a Standard or Custom Dashboard and view the same.

Navigate to the Custom Dashboard section and click the Add icon.

The Create Dashboard window pops up. Here, you can complete the fields as required:
Name: Enter a name to identify the new dashboard.
Choose Report: Add reports associated with Leaderboard, Emails, Calls, Meetings, Opportunities, Tasks, Sequences, and Standard Dashboards to create the dashboard. NOTE: You can select multiple reports.
Privacy: You can restrict access to the dashboard by choosing Everyone or Only Me.

Click Save.
The custom dashboard is saved successfully. You can access all your custom dashboards in the Custom Dashboard section.
TIP: You can customize every dashboard to specific time frames and filtered by individual team members or teams, giving you a complete view of your team's performance and efficiency.
Click the Duration button to select a duration for which you want to view the report.

TIP: You can customize each report in the dashboard by individual filters.

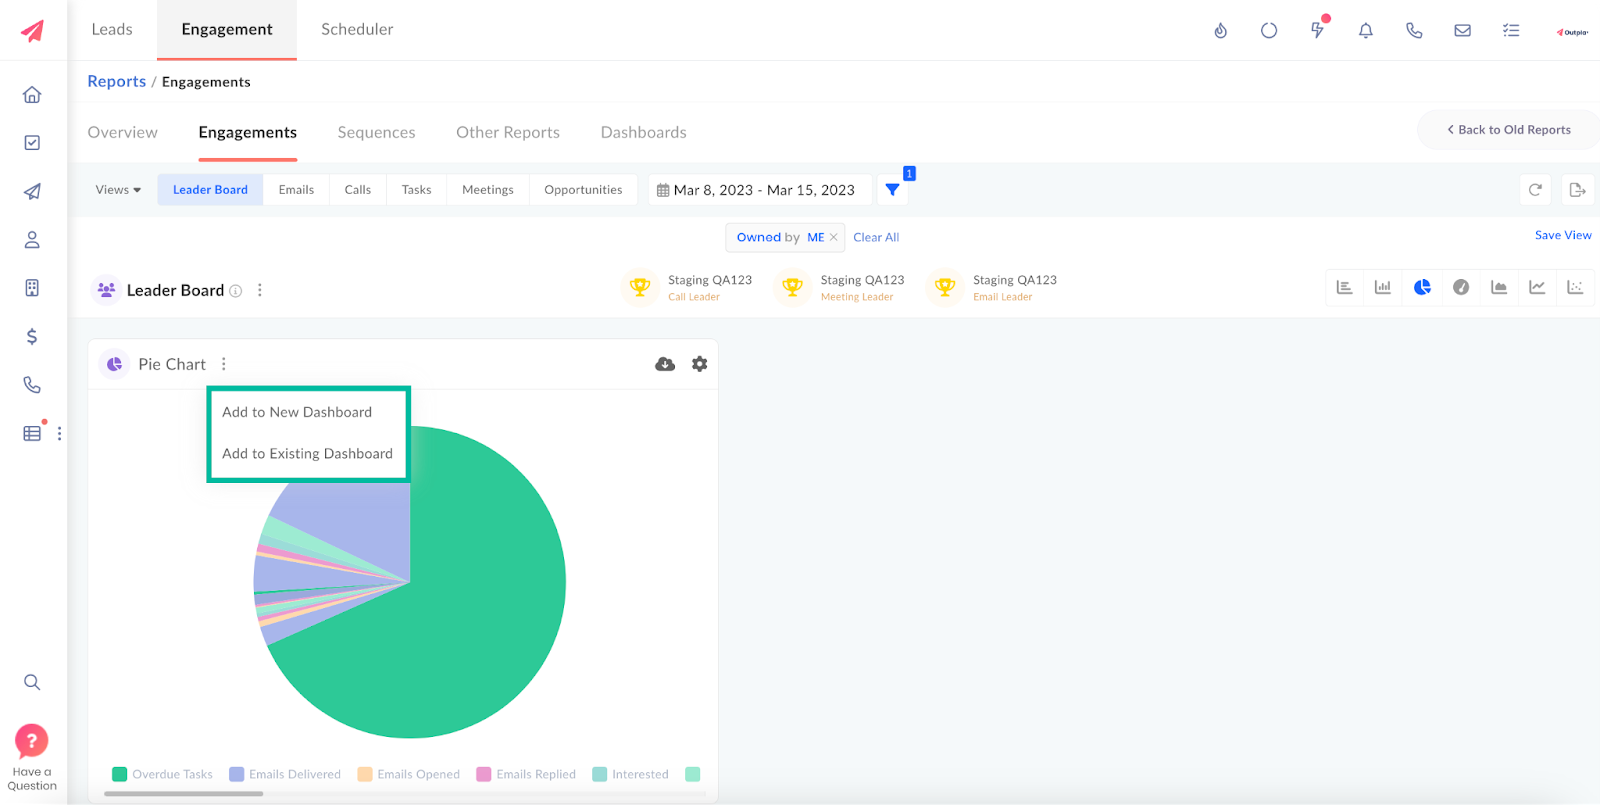
TIP: You can add graphical reports to your custom dashboard. Go to a graphical report of your choice, click the More Options button, and select the Add to a new Dashboard or Add to an existing dashboard option.
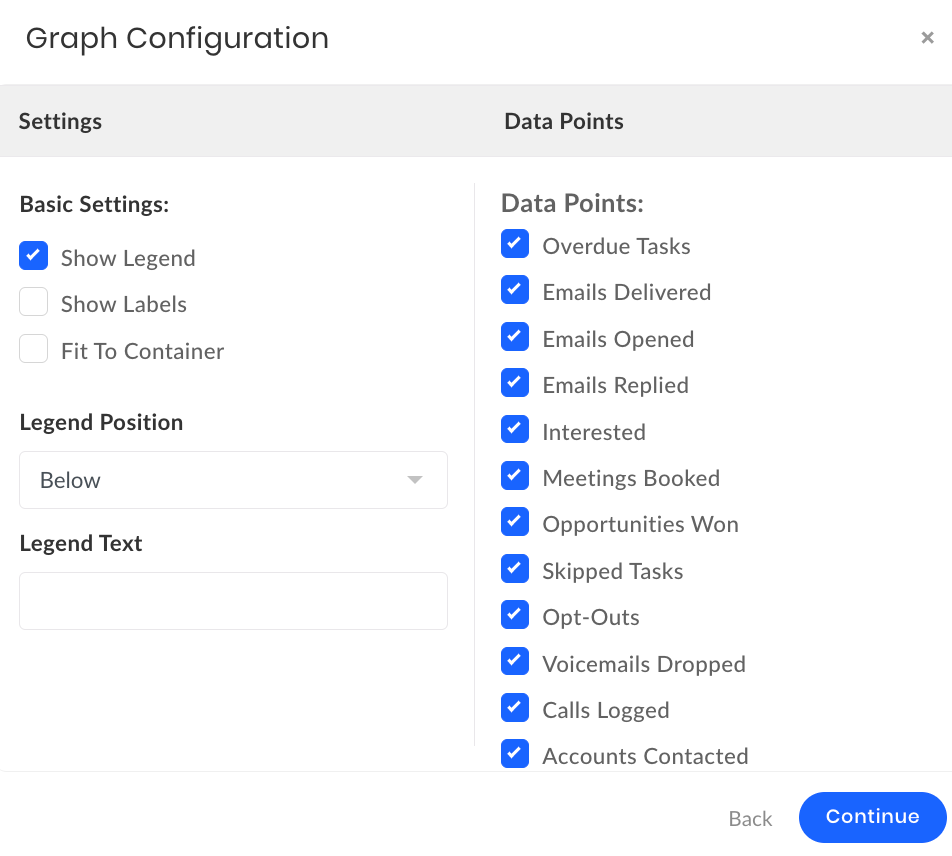
TIP: You can choose to view specific metrics in each graphic report in the dashboard:
Click the Settings button for a report.

Select the metrics of your choice.
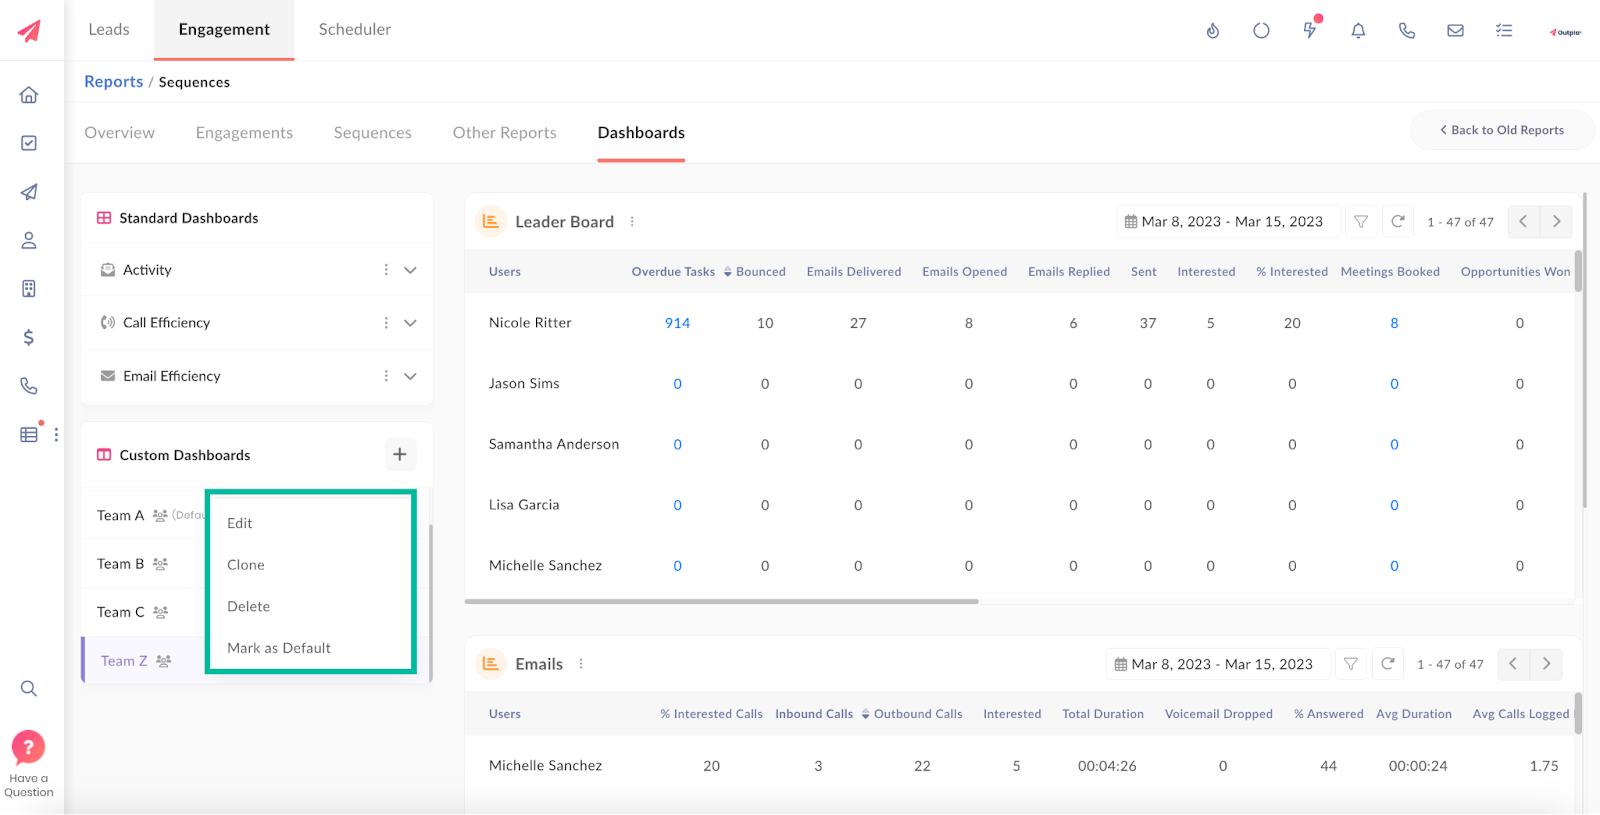
TIP: You can choose to edit, clone, delete, or mark a dashboard as default. To do so, navigate to the Custom Dashboards section → select a custom dashboard of your choice → click the More Options button → and select the action you want to perform.
Updated on: 09/06/2024
Thank you!