Open & Reply Rates, Conversation Percentage, and Best Times to Call
Are your prospects intrigued by your outreach efforts? Find out!
Are your outreach efforts yielding the desired results? Are your prospects responding positively to your emails and calls? Determining the effectiveness of your outreach strategy and finding the right time to connect with prospects can significantly impact your sales success.
With Other Reports on Outplay, you can gain valuable insights into your Open & Reply Rates, Conversation Percentage, and discover the best times to call or email prospects. In this article, we'll guide you through the process of identifying the optimal timing based on prospect activity.
This article discusses the following:
View your Open & Reply Rates for your emails
Analyzing your Open & Reply Rates is the best way to know whether your email outreach strategy is effective. Open Rates show how many prospects are opening the emails you send them. On the other hand, Reply Rates measures the number of outreach emails that get a prospect response.
- Log into Outplay.

- Under the Engagement section, click Reports from the sidebar menu.

- Click Try Our New Reports.

- Click the Other Reports tab.

- Click the Email toggle.

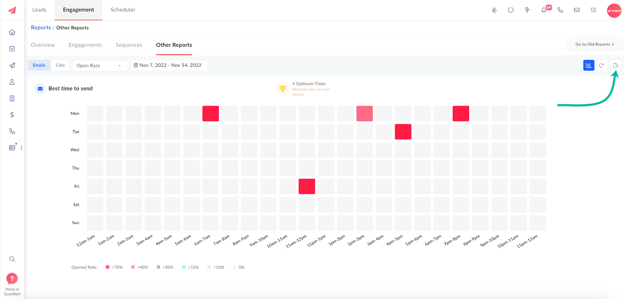
- A heat map highlighting the optimal time to send emails is displayed.

- You can select Open or Reply Rates and view the heat map and optimal time for the same.

- Select the period that you want to analyze.
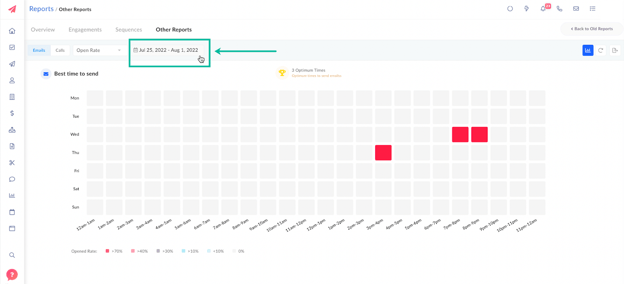
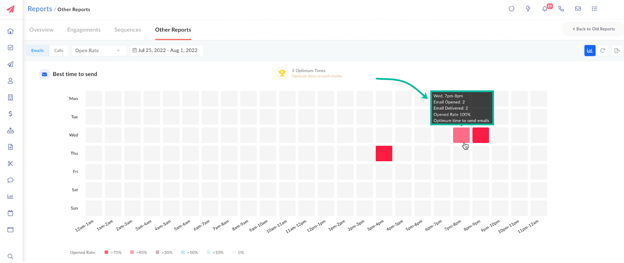
- For Open Rates, you can view the Time Window, Number of Emails Opened, Number of Emails Delivered, and Open Rate when you hover over the hotspots on the map.
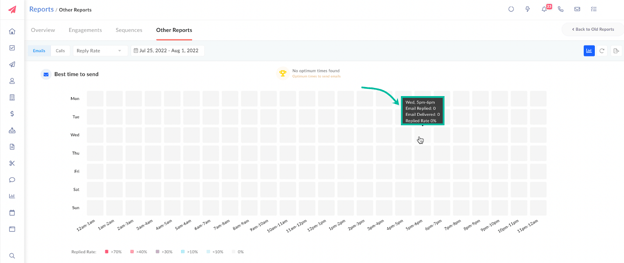
- For Reply Rates, you can view the Time Window, Number of Emails Replied, Number of Emails Delivered, and Reply Rate, when you hover over the hotspots on the map.
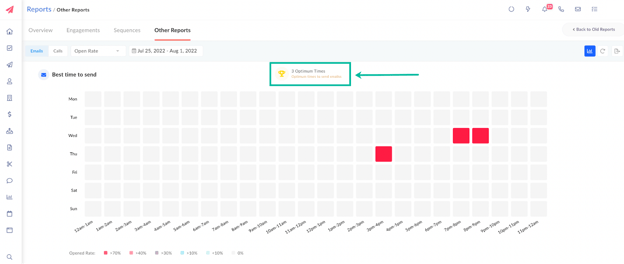
- You can view the best time to send emails displayed on the top panel.
View Conversation Rates for your calls
Other Reports on Outplay allows you to assess the effectiveness of your calls by analyzing the Conversation Percentage, which represents the ratio of answered prospect calls to the total number of calls made.
Here’s how you can view your conversation rates on Outplay:
- Log into Outplay.

- Under the Engagement section, click Reports from the sidebar menu.
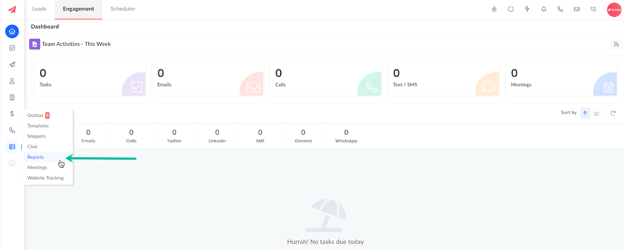
- Click Try Our New Reports.
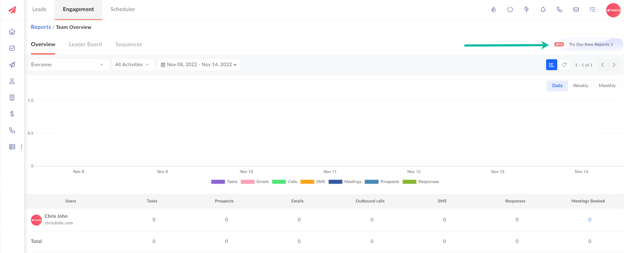
- Click the Other Reports tab.
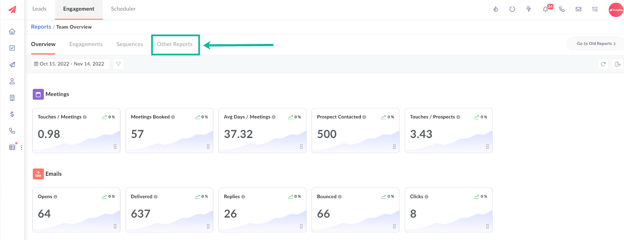
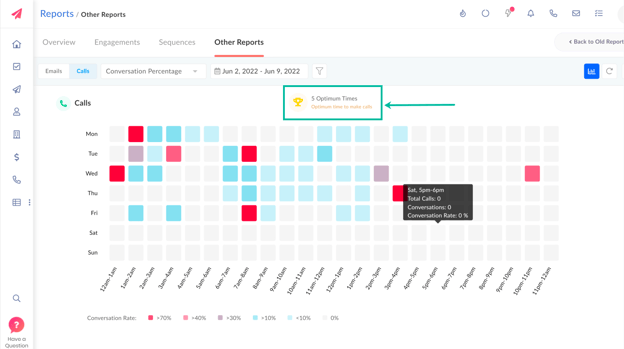
- The Calls section is displayed by default. Here, you can view a heat map highlighting the optimal time to make calls.
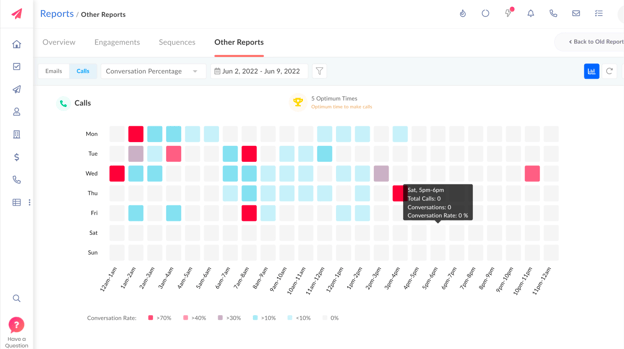
- Select the period that you want to analyze.
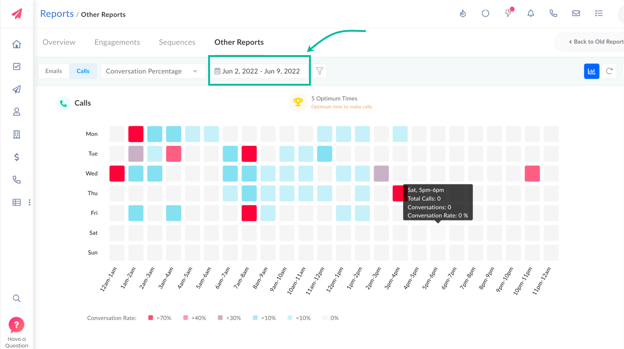
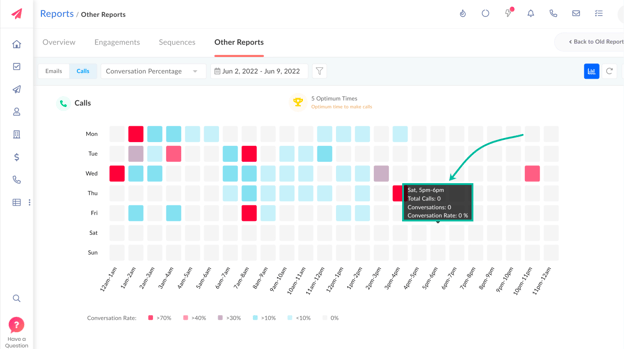
- You can view the Time Window, Total Calls, Conversations, and Conversation Rate, when you hover over the hotspots on the heat map.
- The best time to make calls is displayed on the top panel.
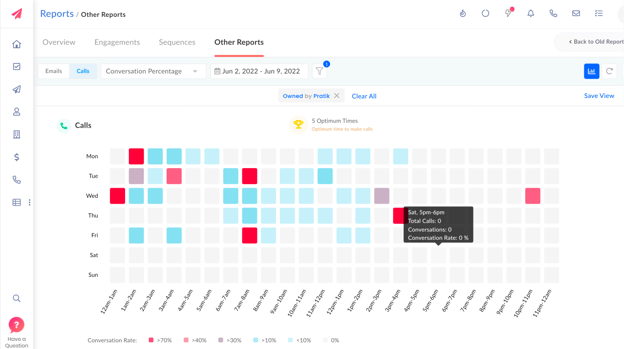
TIP: You can apply filters on the Emails or Calls section to gain better insight and specific data.
- Click Filters.

- Select the User or Team for which you want to analyze the data and click Apply.

- The heat map displays the optimal time for calls or emails for that specific user or team.
TIP: You can click the Export icon to export and download the report to your system as an excel worksheet. If you have applied a filter, only data that meets the criteria set by the filter is exported and downloaded.
Updated on: 09/06/2024
Thank you!